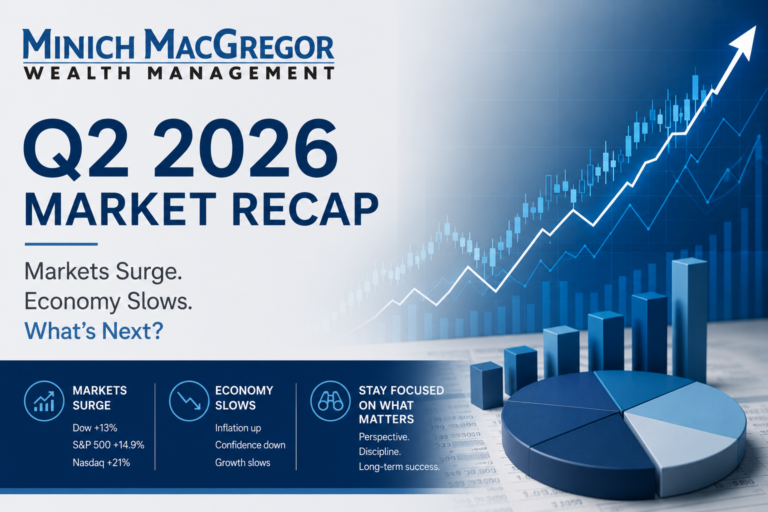
Tag: economy

Q2 Market Recap

One of our favorite metaphors for investing is that it’s like packing a suitcase.

Let’s say you’re preparing for a summer trip to the beach. What would you put in your suitcase?  A swimsuit, probably. Sandals. Sunscreen. Plenty of shorts and t-shirts. Sunglasses and a hat. Then, when you take a step back, you realize you still have space for a few more items. What do you choose?  More beach gear?  Makes sense – after all, it’s the middle of summer, and your destination is famous for being the perfect place to work on a tan.

Or would you pack a pair of pants and a long-sleeve shirt because you guess it might get cold at night?  Would you tuck in an umbrella and fold up a poncho…just in case it rains?

In our experience, some investors are like the tourist who packs for one kind of weather and one type of activity. To illustrate what we mean, let’s recap how the markets performed last quarter.

When 2024 began, inflation was near its lowest point in two years. As a result, many investors figured prices would continue to drop, and the Federal Reserve would lower interest rates sooner rather than later. (And possibly even several times throughout the year.)  In other words, they “banked” on warm weather and sunny skies, then packed their suitcase accordingly.

Well, there’s nothing more frustrating than when unexpected rain ruins fun in the sun. Instead of falling, inflation ticked up through Q1, rising from 3.1% in January to 3.5% in March.1

As a result, when the second quarter began, the mood on Wall Street had shifted substantially. Suddenly, there was no more talk of the Fed cutting rates early and often. Instead, investors began to wonder if the Fed would cut rates at all in 2024. Some economists even speculated that the Fed might raise rates again. So, investors re-opened their suitcases. Out went the swimwear; in went the coats and gloves. It’s no surprise, then, that the S&P 500 dropped 4.2% in April.2

What these investors didn’t realize was that the sun was already starting to peek out from behind the clouds.

Fast-forward to the beginning of July. Looking back, we now know that inflation dropped to 3.4% in April, 3.3% in May, and a surprising 3% in June.1

A big reason for this slide is due to gas prices, which fell by 3.6% in May and 3.8% in June.3 (Energy prices in general fell by 2% in both months.3)  This helped negate the fact that food and housing prices – two of the most stubborn and volatile drivers of inflation actually went up slightly in June.

As you can imagine, the talk has turned once again…to whether the Fed will cut rates sometime in the summer. This renewed optimism, combined with another factor that we’ll get to, helped lift the markets out of the doldrums. For the quarter, the S&P 500 gained 3.9%, while the Nasdaq rose 8.3%.4  

So, what does this mean going forward?  Is it time to repack the suitcase?

The answer is no – because we believe we packed it correctly the first time.

Any savvy traveler knows that when you pack a suitcase, you don’t just factor in what you think will happen. You pack for what could happen. If your goal is to hit the beach, you pack a swimsuit…but since you know it could rain, you also pack a poncho. Your plan is to feel sand between your toes, but if the beach is too crowded, you’ll go for a hike instead…which is why you pack shoes as well as sandals.

The way inflation has gone (up and down) and the way the markets have responded (ditto) shows exactly why investing isn’t about predicting what will happen. It’s about planning for what may happen. You pack a suitcase in a way that ensures your vacation will be fun no matter what. We base our investment strategy in a way that helps you keep working toward your goals, regardless of what short-term market conditions are like.

The fact of the matter is we don’t know whether the Fed will lower interest rates in Q3. Of course, it’s certainly possible that they will. Three straight months of declining consumer prices is certainly a good sign. Even better is that the economy has continued to be solid. (GDP grew by 1.4% in Q1.5 As of this writing, many economists are predicting a 2% rise in Q2.6)  But it’s also possible that a rate cut is still many months away. Trying to guess what will happen in the short-term – and then making moves that could impact you in the long-term – is bad packing.

Then, too, inflation and interest rate expectations are not the only drivers of the markets. Tech stocks – specifically those companies most involved in the development or utilization of AI – helped the markets regain momentum in Q2. Any investor who decided to sit on the sidelines because of pessimism over inflation would have missed out on the optimism surrounding AI. Sure, it’s always a bummer to go to the beach and find it raining…but there are often plenty of other fun things to do on your vacation even when the sun isn’t out

When you think about it, the markets really are like going on a trip. There will always be reasons for enthusiasm and reasons for caution. Everyone who goes to Disneyland can look forward to amazing rides and horrendous crowds. The view from the Grand Canyon is spectacular; the weather can be abysmally hot. The flowers in England are spectacular; the rain can feel oppressive.

And for every factor that can pull the markets down, there will be factors that could push the markets up. Our job is to help you pack a suitcase – and implement an investment strategy with an eye on the long-term forecast – that keeps you prepared for all of it.

So, as we move further into a new quarter, that is just what our team will continue to do. We’ll be keeping an eye on many things this quarter. Inflation, the breadth of the market, the upcoming election – you get the idea. And whenever we feel there’s something on the horizon that could affect the items in your suitcase, we’ll let you know immediately.

In the meantime, if you ever have any questions or concerns, please let us know. And if you have any upcoming summer travel plans, well…be sure to send us pictures!

Have a great week!

1 “Inflation falls 0.1% in June from prior month,” CNBC, https://www.cnbc.com/2024/07/11/cpi-inflation-report-june-2024.html
2 “S&P 500 falls 4.2% in April,” S&P Global, https://www.spglobal.com/marketintelligence/en/news-insights/latest-news-headlines/s-p-500-falls-4-2-in-april-as-market-momentum-loses-steam-81466397
3 “Consumer Price Index Summary, U.S. Bureau of Labor Statistics, https://www.bls.gov/news.release/cpi.nr0.htm
4 “Stops dip as investors digest inflation data,” Reuters, https://www.reuters.com/markets/global-markets-wrapup-1-2024-06-28/
5 “Gross Domestic Product,” U.S. Bureau of Economic Analysis, https://www.bea.gov/data/gdp/gross-domestic-product
6 “GDPNow,” Federal Reserve Bank of Atlanta, accessed July 10, 2024. https://www.atlantafed.org/-/media/documents/cqer/researchcq/gdpnow/RealGDPTrackingSlides.pdf

2024 Q1 Market Recap

Did you fill out a March Madness bracket this year? 

If you did, or if you ever have before, you know what a challenge it can be to predict what will happen during the annual NCAA Basketball Tournament.  Maybe you should just pick the higher-seeded team in every game.  After all, they’re seeded higher for a reason, right?  Or maybe you think a lower-ranked team will surprise everyone and beat one of the favorites.  It happens every year, doesn’t it?  Or maybe you’ll just look to see which teams enter the tournament on a “hot streak” and bet their winning ways will continue. 

Or maybe you’ll just pick whichever mascot you like best.

Whatever strategy you use, every decision forces you to question what you think you know.  Is that top-seeded team’s record for real, or does it hide the real story?  If that underdog David manages to slay the heavily favored Goliath, will it continue winning, or will its story end in the next round?  Does Team A’s superior shooting outweigh Team B’s better defense?  The fact is that there are a million ways to guess, but there’s no single way to know. 

The reason we mention all this is because many investors are facing a similar March Madness-style dilemma with the markets right now. 

Last year, the markets surprised many experts who had predicted a recession by going on a tear.  The S&P 500 finished 2023 up 24%.1  That hot streak continued through the first quarter of 2024.  The S&P gained 10.2% in Q1, its best start to a year since 2019.  The NASDAQ finished up 9.1%.  And the Dow saw a 5.6% gain.2 

This performance was largely driven by one thing: Expectation.

Now, expectation always drives the markets, more or less.  Market performance is dictated by what investors expect will happen in the future based on data they’re seeing now.  In a sense, every investor, expert or amateur, is filling out their own version of a March Madness bracket whenever they make a decision, but for individual companies rather than individual teams…or for the markets as a whole. 

What’s less common is when such high expectations are centered around two very specific things:

  1. That the Federal Reserve will lower interest rates sometime in the near future.
  2. That the potential of AI will yield major profits for companies down the road.

Because many investors expect that one or both things will happen, they want to be positioned to take advantage of them when they do.  So, more money flows into the stock market – especially into companies that would seem to benefit most from these developments – and we experience the kind of quarter that we just saw. 

But now, that leaves investors with questions.  Questions that are eerily like what sports fans ask themselves when filling out a bracket. 

  • Is this performance real…or is it a mirage? 
  • Is it sustainable, or just temporary? 
  • Are we in a bull market…or a bubble? 
  • Does Metric A matter more than Statistic B?  Or should I only pay attention to Indicator C? 
  • Should I just invest based on whichever company logo I like best?

Okay, that last one isn’t real.  But the rest are real questions that investors – expert and amateur – are asking themselves. 

And just like with your bracket, there are a thousand ways to guess the answers.  For example, here are a few arguments – all based on statistics – for why the market’s Q1 performance is “real.”  (Which is to say, sustainable.) 

Inflation is much lower than it was last year, and the Fed has specifically said it wants to cut rates this year.  By the end of February, the Consumer Price Index was at 3.2%, whereas in February of 2023, it was at 6%.3 

The economy remains strong.  Corporate earnings appear healthy, the most recent unemployment rate was 3.9%4, and the Fed’s latest estimate was a 2.5% increase in GDP during Q1.5 

The market’s performance is actually broadening.  It’s an open secret that a major portion of the market’s gains last year were driven by just a small handful of tech companies.  (Most of which are major players in the AI race.)  But that portion broadened significantly in Q1.  Approximately 23% of the companies in the S&P 500 reached 52-week highs.6  And if you gave each company in the S&P 500 an equal weight, the index rose 25% since October.6  (If you gave each company an equal weight in 2023, the index would have only gone up 12% for the year instead of 24%.7)  In other words, more companies are driving the markets rather than just a few.  And that’s good! 

But there are equally compelling arguments for why the market’s performance may not be sustainable.  For example:

Inflation ticked up in Q1 and the Fed has said they’re in no hurry to cut rates.  Consumer prices increased by 0.4% in February after rising 0.3% in January.8  This was largely due to seasonal factors – prices usually go up in winter, partially because fuel tends to be more expensive – but it means the Fed must be even more cautious about lowering interest rates prematurely.  If investors stop expecting rate cuts soon, the markets may well pull back. 

Stocks may be overvalued.  When you divide the size of the U.S. stock market against the size of the economy, you can see how fast the stock market is growing compared to GDP.  If the ratio is heavily skewed in favor of the stock market, it suggests stocks are overvalued relative to how much the economy is producing.  Right now, that ratio is near a two-year high.6 

The hype around AI may be overblown.  Recent technological advances have investors salivating at the possibility that AI will help companies produce more at lower cost…and by doing so, return more value to their shareholders.  But this hype has been going on for well over a year now.  How much AI has contributed in terms of tangible results is an open question.  Developing AI technology is extremely expensive, so if investors decide the return is not worth the expense, the hype may die out. 

So, like with a March Madness bracket, how do we decide what to predict?  Which argument, which statistics, matter? 

The answer: All of them…and none of them. 

Here at Minich MacGregor Wealth Management, we pay attention to all these statistics but are beholden to none.  We use statistics to be alert to any possible opportunities and to be wary of any potential pitfalls.  In other words, we use statistics to help us be prepared for possibilities…not to make predictions. 

You see, what really matters is that we don’t treat investing like March Madness. 

When you fill out a bracket, you are then locked into whatever choices you made.  If you make a wrong choice, you must live with it. It’s too late to change anything.  But our strategy is far more flexible.  Imagine you filled out a bracket but could then adjust in real time depending on how different games were trending.  Furthermore, imagine you could exit out of your bracket altogether, if necessary, and then start participating again later. 

That’s what we can do every day with the markets.  Furthermore, we’re able to focus on the metrics that are proven to matter: Primarily, the law of supply and demand.  As a result, we don’t have to make predictions, hope we’re right, and then hold on no matter what.  We measure how various stocks and sectors – or teams and regions, in March Madness parlance – are trending.  When they trend above a certain point, we play offense with your portfolio.  When they trend below, we play defense.  Experience has convinced us that this approach – being flexible and adaptable – is the surest way to your destination. 

As always, though, let us know if you have any questions or concerns.  While we’re hardly qualified to give bracket advice, our team is always here to help you with a different sort of Big Dance: The one that takes place where you want it, when you want it, with the people you want to share it with.  

1 “Stocks close out 2023 with a 24% gain,” CBS, www.cbsnews.com/news/stock-market-up-24-percent-2023-rally/
2 “The SP 500 just turned in its best first quarter since 2019,” CNN Business, www.cnn.com/2024/03/28/investing/premarket-stocks-trading-first-quarter/index.html
3 “12-month percentage change, CPI,” U.S. Bureau of Labor Statistics, www.bls.gov/charts/consumer-price-index/consumer-price-index-by-category-line-chart.htm
4 “The Employment Situation – February 2024,” U.S. Bureau of Labor Statistics, www.bls.gov/news.release/pdf/empsit.pdf
5 “GDPNow,” Federal Reserve Bank of Atlanta, www.atlantafed.org/cqer/research/gdpnow
6 “Warren Buffett’s favorite market indicator is flashing red,” CNN Business, www.cnn.com/2024/03/27/investing/premarket-stocks-trading/index.html
7 “S&P 500 Equal Weight Index” https://www.spglobal.com/spdji/en/indices/equity/sp-500-equal-weight-index/#overview
8 “Consumer Price Index – February 2024,” U.S. Bureau of Labor Statistics, www.bls.gov/news.release/cpi.nr0.htm

Understanding the Market Correction – 2023

You probably saw the news: On October 27, the S&P 500 officially slid into a market correction.

A correction is when the markets decline 10% or more from a recent peak.  In the S&P’s case, the “recent peak” was on July 31, when the index topped out at 4,588.1  On Friday, the index closed at 4,117 – a drop of 10.2%.1 

Market corrections are never fun, and there’s no way to know for sure how long one will last.  Historically, the average correction lasts for around four months, with the S&P 500 dipping around 13% before recovering.2 Of course, this is just the average.  Some corrections worsen and turn into bear markets.  Others last barely longer than the time it took for us to write this message.  (On Monday, October 30, for example, the S&P actually rose 1.2% and exited correction territory.3) Either way, corrections are not something to fear, but to understand – so that we can come through it stronger and healthier than before. 

To do that, we must understand why the markets have been sliding since July 31.  We use the word “slide” because that’s exactly what this correction has been.  Not a sharp, sudden drop, but a gradual slide, like the bumpy ones you see on a playground that rise and fall on the way to the ground.   While the S&P 500 dropped “at least 2% in a day on more than 20 occasions” in 2022, that’s only happened once in 2023, all the way back in February.4    

At first glance, it may seem a little puzzling that the markets have been sliding at all.  Do you remember how the markets surged during the first seven months of the year?  When 2023 kicked off, we were still coming to terms with stubborn inflation and rising interest rates.  Many economists predicted higher rates would lead to a recession.  But that didn’t happen.  The economy continued to grow.  The labor market added jobs.  Inflation cooled off.  As a result, many investors got excited, thinking maybe the Federal Reserve would stop hiking rates…or even start bringing rates down. 

Fast forward to today.  The economy continues to be healthy, having grown an impressive 4.9% in the third quarter.5  Inflation is significantly lower than where it was a year ago.  (In October of 2022, the inflation rate was 7.7%; as of this writing, that number is 3.7%.6)  And the unemployment rate is holding steady at 3.8%.7  But the markets move based either on excitement for the future, or fear of it – and these cheery numbers no longer generate the level of excitement they did earlier in the year. 

The reason is there are simply too many storm clouds obscuring the sunshine.  While inflation is much lower than last year, prices have ticked up slightly in recent months.  (We mentioned the inflation rate was 3.7% in September; it was 3.0% in June.6)  As a result, investors are now expecting the Federal Reserve to keep interest rates higher for longer.  Seeking to take advantage of this, many investors have moved over to U.S. Treasury bonds, driving the yield on 10-year bonds to its highest level in 16 years.  Since bonds are often seen as less volatile than stocks, when investors feel they can get a decent return with less volatility, they tend to move money out of the stock market and into the bond market.

As impressive as Q3 was for the economy, there are cloudy skies here, too.  This growth was largely driven by consumer spending – but how long consumers can continue to spend is an open question.  Some economists have noted that Americans’ after-tax income decreased by 1% over the summer, and the savings rate fell from 5.2% to 3.8%, too.5  Mortgage rates are near 8%, a 23-year high.8  Meanwhile, home sales are at a 13-year low.9  All this suggests that the Fed’s rate hikes, while cooling off inflation, have been cooling parts of the economy, too.

Couple all this with violence in the Middle East, political turmoil in Congress, and a potential government shutdown later in November, and you can see the problem.  Despite the strong economy, investors just aren’t seeing a good reason to put more money into the stock market…but lots of reasons to think that taking money out might be the prudent thing to do.  It’s not a market panic; it’s a market malaise.    

So, what does this all mean for us? 

We mentioned how the markets operate based on excitement for the future, or fear of it.  But that’s not how we operate.  We know that, while corrections are common and often temporary, they can worsen into bear markets.  Furthermore, any decline can have a significant impact on your portfolio, and by extension, your financial goals.  So, while our team doesn’t believe in panicking whenever a correction hits, neither do we believe in simply standing still.  Instead, we’ll continue to analyze how both the overall market – and the various sectors within the market – are trending.  We have put in place a series of rules that determine at what point in a trend we decide to buy, and when we decide to sell.  This enables us to switch between offense and defense at any time.  This, we feel, is the best way to keep you moving forward to your financial goals when the roads are good…and the best way to prevent you from backsliding when they’re bad. 

In the meantime, our advice is to enjoy the holiday season!  Our team will continue to focus on investments, so our clients can focus on why they invest: To create happy memories and live life to the fullest with their loved ones.  Happy Holidays! 


SOURCES:

1 “S&P 500,” St. Louis Fed, https://fred.stlouisfed.org/series/SP500

2 “Correction,” Investopedia, https://www.investopedia.com/terms/c/correction.asp

3 “Stocks rebound to start week,” CNBC, https://www.cnbc.com/2023/10/29/stock-market-today-live-updates.html

4 “S&P falls into correction,” Financial Times, https://www.ft.com/content/839d42e1-53ce-4f24-8b22-342ab761c0e4

5 “U.S. Economy Grew a Strong 4.9%,” The Wall Street Journal, https://www.wsj.com/economy/us-gdp-economy-third-quarter-f247fa45

6 “United States Inflation Rate,” Trading Economics, https://tradingeconomics.com/united-states/inflation-cpi

7 “The Employment Situation – September 2023,” U.S. Bureau of Labor Statistics, https://www.bls.gov/news.release/pdf/empsit.pdf

8 “30-Year Fixed Rate Mortgage Average,” St. Louis Fed, https://fred.stlouisfed.org/series/MORTGAGE30US

9 “America’s frozen housing market,” CNN Business, https://www.cnn.com/2023/10/19/homes/existing-home-sales-september/index.html