Understanding Market Indices: A Visual Guide

When you hear the phrase “the stock market” in the news, it’s usually shorthand for a market index — but what exactly does that mean?
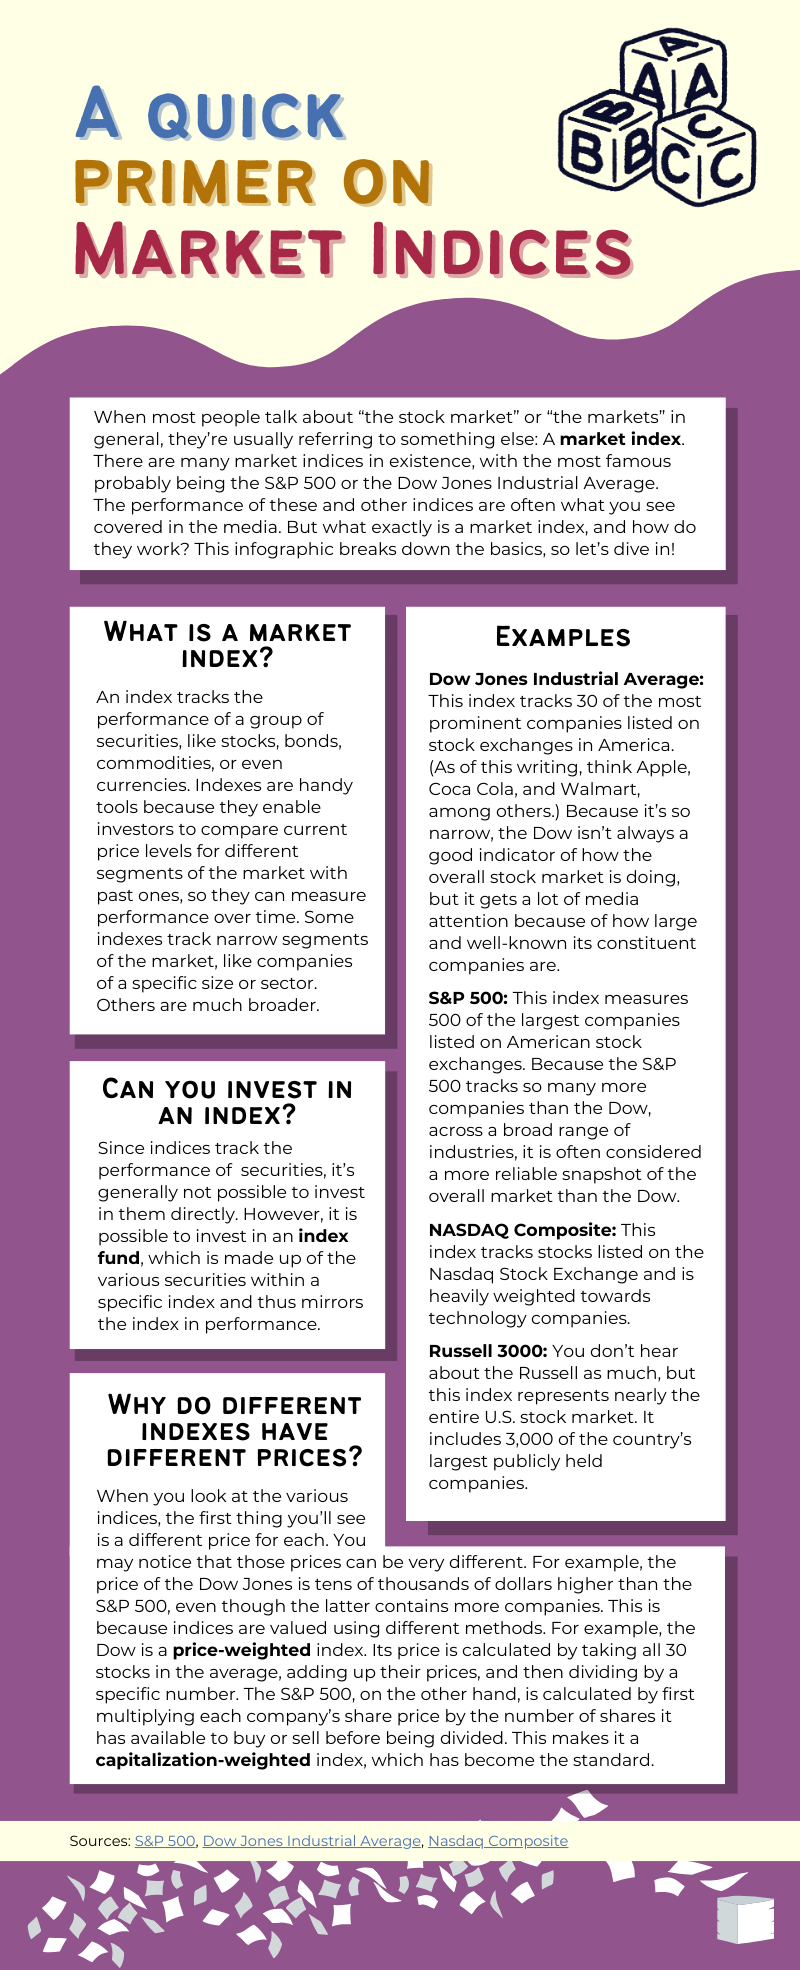
Market indices, like the Dow Jones, S&P 500, and Nasdaq Composite, are some of the most-watched measures in finance. They shape headlines, move markets, and give investors a snapshot of performance. But because each index is built differently, they can tell very different stories about “the market.”
That’s where our new infographic comes in. 📊
It breaks down:
- What a market index is and why it matters
- How different indices (like the Dow vs. the S&P 500) are structured
- Why index values look so different — and what those numbers really mean
- How investors can actually use indices in practice
Whether you’re new to investing or just want a clearer understanding of the numbers behind the headlines, this guide makes it simple.