Economic Lows. Market Highs. What’s Next?

Economic Lows. Market Highs. What’s Next?
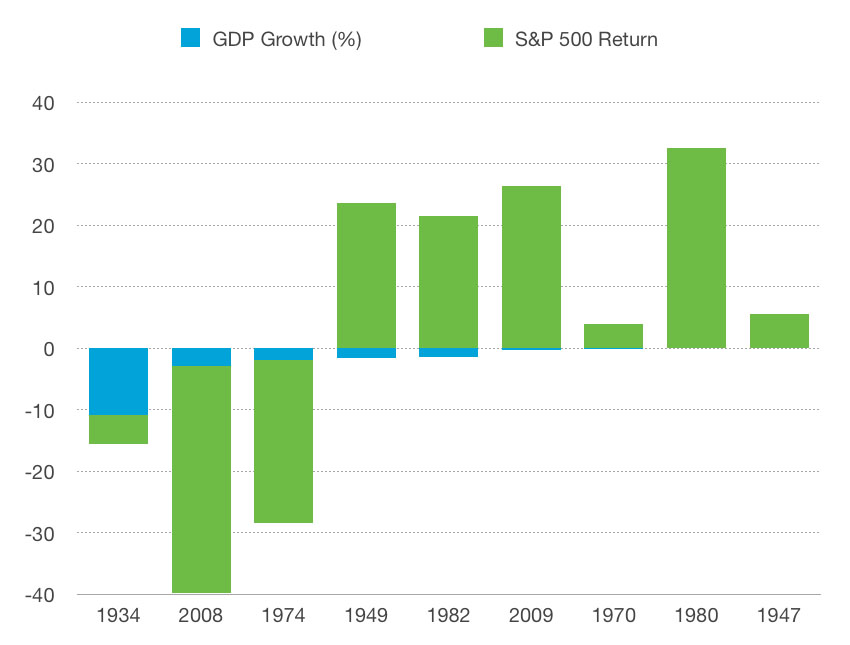
The confounding thought about the market has been: the economy is struggling, and yet the market is up. I created a bar chart out of the 2 statistics: GDP Growth and S&P Return, and then listed the year this occurred. And then I have provided the actual numbers that support the chart, since there have been years with negative GDP that do not make a bold statement on the chart.
Notice, of the years shown, that in 1982 when arguably we were in the beginning stages of the bull market that lasted until the end of the 1990’s, that same year we had a negative GDP of -1.4%. Notice the more “obvious” years, 1934, 2008, 1974, … there was no shock that a negative GDP correlated with a negative S&P… bad economy, bad market.
Our system of relative strength, shows the US Equities dominance since October 24, 2011. And, currently, the numbers still overwhelmingly support that dominance going forward.

After experiencing two major bear markets in the last decade, investors big and small are demanding risk management. However, it is important to remember that part of risk management is seeking to manage downside risk and part of it is seeking to capitalize in strong equity markets.
As a firm, we try to avoid economic forecasting. As Yogi Berra, the great catcher and baseball coach said, “You can learn a lot by just watching.” Be confident: we are watching.