Minich MacGregor Wealth Management Minich MacGregor Wealth Management Minich MacGregor Wealth Management Minich MacGregor Wealth Management Minich MacGregor Wealth Management

International Quantitative Easing having an effect overseas?

“International” Quantitative Easing having an effect overseas ?

For the past few years the US stock markets have been the consistent front-runners for growth investing. That said, we are seeing early signs of strength from the international markets.

In Europe, quantitative easing was announced last year, much like the US government’s quantitative easing from a several years prior which helped boost the US stock markets. The latest numbers may indicate that this action has begun to have a similar positive effect overseas.

On a relative strength basis, we are still seeing the US stock markets as the leaders with US fixed income coming in second. However, international equity markets are now third and gaining momentum. Not enough movement for any wholesale change in strategy, but another indicator that is a ping on the RADAR that we are watching closely.

Here are links to Investopedia’s definitions of Quantitative Easing and Relative Strength.

Minich MacGregor Wealth Management Minich MacGregor Wealth Management Minich MacGregor Wealth Management Minich MacGregor Wealth Management Minich MacGregor Wealth Management

Exhale Signals from an overbought market

This is the first of our new Weekly Wire series.  Our clients often ask us for our take on recent events or market conditions. Weekly Wire’s are short and sweet, but we hope they will give you some insight into our thought process and spark some great questions.  Let us know what you think, we always like to hear from you!

“Exhale” Signals from an overbought market

Last week the US equity markets pulled back a little. The Dow Jones Industrial Average and the Standard & Poor’s 500 Index each fell every day last week before edging higher on Friday. Our short-term indicators predictably switched to sell; however, medium and long term indicators remained substantially unchanged.  Our collective take on the week was that it represented a bit of a collective exhale from an overbought market, which is not too surprising.

What this means to our clients is that the recent pullback is part of the normal ups and downs of the capital markets. Our short term indicators are not used to “time” the market with existing accounts. Rather these indicators work well in deciding when to use a dollar cost average strategy when committing new cash to invest.

Here is a link to Investopedia’s definition of overbought market

All investment strategies have the potential for profit or loss. Changes in investment strategies, contributions or withdrawals may materially alter the performance, strategy and results of your portfolio. Different types of investments involve varying degrees of risk, and there can be no assurance that any specific investment will either be suitable or profitable for a client’s investment portfolio. Economic factors, market conditions, and investment strategies will affect the performance of any portfolio and there are no assurances that it will match or outperform any particular benchmark.  

The Cost of Waiting to Invest: 39 Reasons NOT to Invest

The Cost Of Waiting to Invest:

39 Reasons Not To Invest

Cost of Waiting to Invest
Click to View

It is relatively common for us to talk to clients and prospective clients who have money that is parked in a bank savings account or money market fund.  These funds could be from a real estate deal, a business sale, inheritance or even a maturing CD / annuity.  It could be simply a remnant from the last perceived bear market event; where at some point, the losses or fear of losses, were just too much to emotionally take so money was moved out of the market to cash.  So here the money sits, earning next to nothing on the sidelines, sometimes for years.  The question is – now what?

Often we hear “I really want this money to grow, but I have to wait and see what happens with [insert news or market event here] first.”  That news or market event changes all the time and there is no shortage of media hype to fuel investor concerns.  We sometimes see investors getting caught in a cycle where there is always some concern that keeps the money out of the market earning very little.

So the investor is at crossroads: Do they wait for the “perfect time” to do something with the money or do they throw caution to the wind and jump in with both feet despite that big story on CNBC yesterday? The reality is, there is never a “perfect time.”  Intuitively most people get that, but that alone often isn’t enough to allow them to comfortably make the decision to get the money off the sidelines. We find having a disciplined system in place that gets the funds invested based on a sound process using impartial data rather than media hype, is a better alternative.

If you’re considering all the reasons why you should not be investing in the stock market, the table linked below lists some of the reasons that have kept others (and maybe you too) on the sidelines in the past. You may notice however, the waiting can be a costly decision. Every year there are problems that look like they will derail the market. And this year’s problem always seems far more serious than anything that’s ever occurred in the past. But it never is.

Click here for the 39 Reasons NOT to Invest

Taking emotion out of your finances
The genius behind intelligent investing
Shifting mental financial gears retirement
Timing isnt everything or is it
Tips for preventing fraud
Two car garage
Uncertain times demand certain understanding
Words to live by 2 change

Diversification: Cure or Curse

Diversification: Cure or Curse

Investment WorkshopsInvestment terms and investment language have a tendency to be confusing and frustrating. However one term that seems to reach immediate common understanding is diversification. It’s so universal that most times there is no need for explanation. That’s the good news. The bad news is that “diversification” is used so liberally, that it is not how the word is defined that is critical, it’s how the word is used.

Diversification as a broad concept is simply the law of large numbers. As an investor, the greater the number of different investments that you hold, the more protected you are against absolute loss. “Don’t put all your eggs in one basket.” A good example of this involves the now defunct corporation Enron. If you owned 100 different stocks, one of which was Enron and you watched Enron go bankrupt, you could say to yourself, “thank goodness I was diversified, I still have 99 stocks.” You were, in fact, protected from absolute loss by having a diversified portfolio.

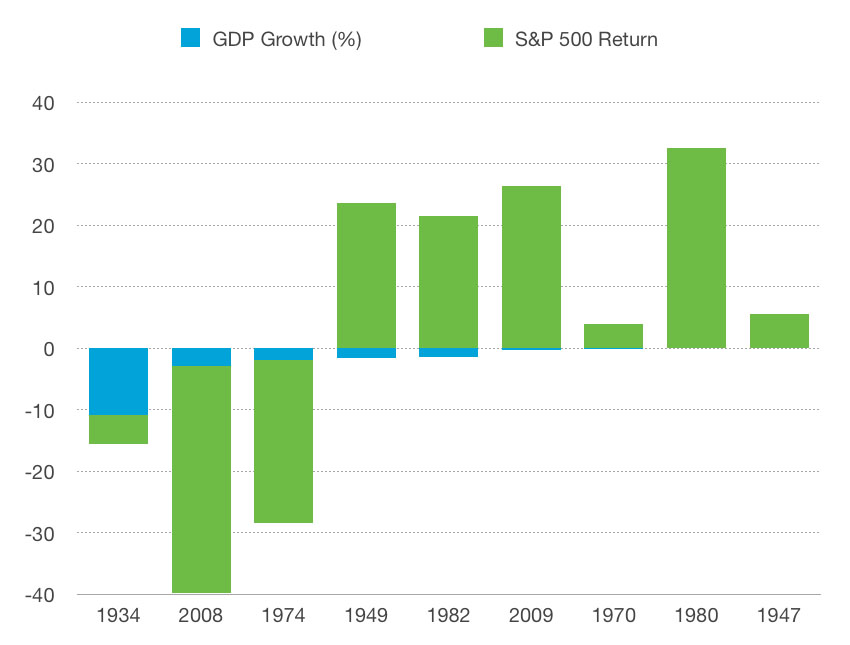
When the term is used in connection with managing market volatility, things get a bit more complicated.  Simply owning hundreds of large US stocks when the US stock market is in decline, won’t do much to protect the investor from market volatility risk.  If you owned an S&P 500 index fund in 2008 and simply rode out the year, you were by definition diversified; however, your portfolio experienced the same volatility as the market.

Being able to manage market volatility is about enjoying the ride, and surviving catastrophes. The term asset allocation and diversification often get incorrectly used synonymously, though they are related in terms of managing market volatility. The term asset allocation is simply diversification of capital across the broad asset classes. So for example, the six broad asset classes are: US equity, international equity, commodities, fixed income, currency, and cash. Over the last 40 years, the investment community has focused on the decision on how much to allocate to the six asset classes.

There are three benefits to that decision:

  1. Reducing volatility (the month-to-month change in portfolio value)
  2. Improving portfolio response to financial catastrophes
  3. Improving performance using the right combination of investments.

In general, diversifying a portfolio across the broad asset classes changes the inherent risk of market volatility. Simply stated: the more money that you have in stocks, the greater the risk and the more money that you have in bonds and cash, the lower the risk.

Okay this is where it gets really complicated. Asset allocation can be applied passively or actively. Passive allocation, often called “buy and hold” means that you are able to determine, as a rational human being, what the best combination of asset classes for you is and you hold that through the ups and downs in the market. This is the current “cure-all” that is often offered to private investors.

There are a few problems with this cure-all though. First, it’s very difficult for us all to be rational and unemotional about money. After all, the loss of money means reducing our personal options in life, which is no fun for anyone. In addition, once you admit to the desire to change the allocation to your investments in any of the broad asset classes, you open the door to the curse of when and how do you do it. (You shift from a passive approach to an active or tactical approach) Tactically allocating or diversifying among the broad asset classes allows investors to take a more proactive approach to managing market volatility risk. However, the “tactics” that you might use to make the decision of redeployment of capital open the door to the same problem that you had before you started the process, which is how do I best allocate and diversify my portfolio?

Instead of falling through the trap door of diversification, we believe instead, the following: diversification using the law of large numbers is a good thing to protect against absolute loss. A good example is the use of index funds covering either broad market indexes such as the S&P 500 or the Dow Jones industrial average, or sectors like financial services or healthcare. Additionally, decisions on making tactical changes to your asset allocation need to be handled on an ongoing basis, and this diversification among the broad asset classes, when done properly, can help protect against short-term volatility and long-term catastrophe.

Check out other articles
Do you know what motivates your financial adviser
Dos and donts for securing your financial future
Economic lows market highs whats next
End of world market

Is your investment strategy based on a solid plan or hope?

Is your investment strategy based on a solid plan or hope?

In mid-October a client called in a slight state of alarm to discuss the recent pullback in the U.S. stock market. As a retiree, his main concern was if the markets continue to fall what will happen to his nest egg. At that time the S&P 500 stock index had fallen approximately 9 percent from its high in late September. The decline was all over the nightly news and all the talking heads were having a field day making wild predictions ranging from what we call “doom and gloom end of world scenarios” to more moderate, run-of-the-mill gyrations of the stock markets that soon will pass.

Register BlockThe conversation was an opportunity to reinforce the differences between an investment strategy with a plan of action vs. investing with a plan of hope.A plan of action has a predefined set of steps (buy and sell strategies) to take in response to both positive and negative market trends.

In the case of negative market movements, you employ your sell discipline; sometimes called risk management. Risk management involves defining a series of buy/sell indicators that drive your action. Based on factors that measure supply and demand levels, indicators help create exit points in a falling market. It’s like drawing a line in the sand for a particular investment. If the line is crossed on the downside the decision to sell is executed. Your risk tolerance and your overall temperament for portfolio fluctuations may influence exactly where that line is drawn. If you are a conservative investor your indicators may trigger getting out of the market sooner than someone who is aggressive.

On the flip side, you need to watch the same indicators for signs that the market has bottomed out and it’s time to start getting back in the game. In addition to defining buy/sell indicators, it’s helpful to rank various asset classes and sectors and have the willingness to rotate your money into those areas when they’re performing well. In most years the difference between the top-ranked sectors of the stock market versus the bottom sectors can exceed 50%. If you’re unwilling to establish criteria for when you’ll move your money in and out of them, you could end up leaving a lot of cash on the table.

An established plan of action with pre-determined buy/sell points – and adhering to the plan – is at the heart of a disciplined investing.

Without a plan or discipline, you’re left with a strategy based on hope – hope that the markets will stop going down, hope that a sector will turn around, etc. Grasping at intangibles like these often leads to either inaction or terribly misdirected action; neither of which brings you any closer to a comfortable retirement or provides a nest egg that will last throughout retirement.

“I knew it all along” – Avoiding the Hindsight Bias Trap

“I knew it all along” – Avoiding the Hindsight Bias Trap

How many times have you looked back at some event that, at the time, was a surprise but with the benefit of hindsight seemed so obvious? It happens frequently, and the common adage of “hindsight is 20/20” gets repeated all the time. It’s the tendency for people to look back on an event and say “I knew it all along!” In reality it would have been impossible to “know” for sure the outcome until after it occurred.

Register BlockIn investing this also occurs on a regular basis and is known as “hindsight bias.” This bias helps people save face after a bad decision (I knew that was going to happen), and possibly the most dangerous effect in investing is creating over confidence after a series of good decisions, which then leads to excessive risk taking.

For example, over the last 18 months many health care and biotech stocks have been soaring. Fifty, seventy-five and even one hundred percent gains in a short period of time have been common. With hindsight bias at work, investors can fall into the trap of thinking the reason this sector has done so well is obvious, and have a false impression that this is what will happen going forward. A large portion of their portfolio gets allocated to one sector because they believe their predictive skills are finely tuned. Too much confidence in one’s predictive ability can be harmful to one’s wealth.

Another great example is when market “bubbles” burst. Going back to the dot-com crash of the early 2000’s, or the financial melt-down of 2008 it’s very common to hear phrases like “everyone knew it was going to crash,” or “of course the bubble burst.” However, in the midst of those events it is never that clear.

One of the ways to become a better investor is to learn from past investment mistakes. Hindsight bias can get in the way of that. After the fact it’s very easy for people to attribute the wrong reasons why an investment didn’t go well and, conversely give the wrong reasons why a certain investment did very well.

A good way to overcome this bias is to keep notes at the moments you are making your investment decisions. Do your analysis, write down the reasons why something is being bought or sold and keep a journal of your decisions. This way you can look back and read your actual notes from months and years ago, and not be subject to hindsight bias’ revisionary history.

This also reinforces the idea that investing process trumps investment product. The focus should be on the process of how you make your investment decisions, and by fine-tuning, practicing, and continually improving the way you make your investment decisions your track record will improve and you will see a bright investment future.

Check out other articles
401k resolutions 2014 401k rolloever
Weekly wire buy sell indicators
22 its your 401k take control
4 keys achieving better 401k results

Investment Portfolio Crisis Counseling

Investment Portfolio Crisis Counseling

I’ve enclosed a picture taken on the Golden gate Bridge in San Francisco. Notice that the sign that’s in the picture …“THERE IS HOPE MAKE THE CALL” …is placed there to help, and possibly deter, people thinking of ending it all by jumping off the bridge.  I am inclined to believe that the sign was placed on the bridge with good intent. Clearly, in a world where some people think that the common sentimbridgeent amongst people is indifference, the sign seeks to overcome the feeling that nothing is worth it and nobody cares. The question becomes is the sign too-little-too-late?

If I were to come up with a sign that was the equivalent in portfolio management, it would say, RISK MANAGEMENT, IT’S NEVER TOO LATE. Managing your own money or other people’s money inherently raises a question of “what are we doing about risk”?

The problem in the area of risk management, is that the words “risk management” mean something different to everyone.  One possible definition of risk management could be:  the evaluation of financial risks, together with the identification of procedures to avoid or minimize their impact. The definition is nice because it’s very broad. Which means it can pull within its “umbrella” a whole host of ideas.  In the same way that a sign says,  “THERE IS HOPE MAKE THE CALL”, a sign that says,  “RISK MANAGEMENT, IT’S NEVER TOO LATE” is both vague and specific at the same time.

So for example, the word “hope” covers a lot of ground. What is missing is the specificity of the word hope as it applies to an individual. Hope could mean everything from, getting a new job, to a cure for a disease. So if we were to change the sign from,  “THERE IS HOPE MAKE THE CALL” to “THERE IS HOPE, MAKE THE CALL, 800 555 3456,  FOR A NEW JOB”. The specificity of the hope makes the resolution of the problem all that much more real. It’s the same with risk management, the more specific the steps that will be taken, when a change in the market requires action, the more confident you will be that you’re doing the right thing. So for example: “if the relative strength for bonds exceeds the relative strength of stocks, reduce the percentage of stocks in my portfolio by 15%”.   This is very specific, based upon two specific actions. Action number one, relative strength of stocks is exceeded by the relative strength of bonds. Action number two reduce the percentage of stocks owned by 15%.

Okay let’s return to the picture. Notice that the third warning in blue says,  “THE CONSEQUENCES OF JUMPING FROM THIS BRIDGE ARE FATAL AND TRAGIC”.  Establishing risk management procedures, that are both specific and meaningful are the resolution to something that financially could be “Fatal and Tragic”.

Check out other articles
Investment guidance advisor vs broker
Investment strategy based solid plan hope
Its all about greece
Weekly wire its all relative strength

Magazine Articles as Market Indicators

Magazine Articles as Market Indicators

Magazine cover stories have a tendency to emphasize the popular belief at the moment the article is published.  Or to put it another way, what the market is doing today is taken as an indicator as to what the market will do in the future.

bw081414_mag_covers-(1)
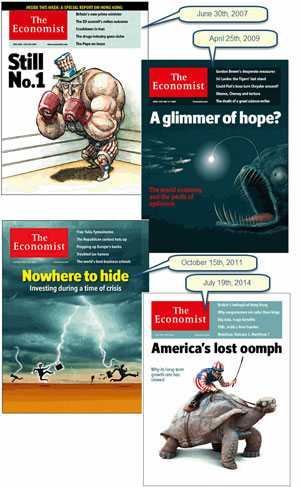
I present for your analysis four Economist magazine covers. The first two covers are from the period punctuating the end of the bull market in 2007, and the beginning of the current bull market in April of 2009.  Clearly the positive tone of the June 2007 cover was missing the hidden problems of the mortgage market.  And the April 2009 article emphasized the gloom and doom of what had happened in 2008 and the beginning of 2009, but underestimated the gathering improvement in the market.  The next two covers do not cover the entire bull market to date, but certainly the period when United State equities started to dominate.  October 15, 2011 capped a period from about May of 2011 until mid October of the same year when the market was down about 19%, so the sobering thought was that all hopes of market improvement were off.  And, really, that was the point based on our relative strength analysis, that US equities moved into first place ranking; usually a good sign for investors.  Fast forward to the most recent cover, if nothing else, the cover would challenge the most bullish of investors to question the continuation of the bull market.

So do magazine covers and articles present misleading thoughts?  Or should we think the opposite of what the news talks about?  I think the right “take away” should be to reserve judgement until the indicators actually make the change.  Meaning that relative strength indicators are structured in such a way that when things are good, the indicators are by and large good.  And when the indicators are bad, the indicators are by and large bad.  Over time what I have found is that the reason that investors have problems doing the right thing at the right time is that they have trouble believing the indicators.


4 Keys to Achieving Better 401k Results

4 Keys to Achieving Better 401k Results

There’s no time quite like summer to find fun ways to spend money. we may be wrong, but we’re pretty sure that getting better 401k results rarely – if ever – makes the top five of the “fun” things to think about doing with your money while on vacation. But the truth is, even though you’re taking time off, your retirement account is not. The market’s changing, your plan offerings may be changing, and your goals may be, too. With just a few minutes of effort (really, just minutes), you can quickly assess if you’re on track to the ultimate vacation from work down the road. Here’s what I recommend:

Register BlockREVIEW YOUR CONTRIBUTION RATE

With the decrease and elimination of many pension plans, many advisors suggest saving at least 15 percent of your pre-tax income to be able to replace your working income in retirement. If you aren’t at that level, set a course to get there. Pick regular intervals (every six months or raise time) and commit to add an additional percent or three or four to get to that 15 percent ASAP.

MAKE SURE YOU’RE GETTING THE MATCH

If you only do one thing, this is it. Make sure you are contributing enough to get any employer match that may be offered. If your employer offers a 5 percent dollar-for-dollar match and you are only putting in 3 percent of your pay, you are literally letting “free” money slip through your fingers. By getting every dollar in company match, you double your contribution rate without lifting a finger.

REVIEW YOUR CURRENT ALLOCATION VERSUS WHAT YOU WANT YOUR ACTUAL ALLOCATION TO BE

Over the last few years (particularly last year) the stock market has had very strong gains. If you haven’t looked at your allocations in a few years, things may have shifted. What was once a 70 percent stock fund allocation may not be sitting above 80 percent. While growth is good, it does put you at risk of having too many nest eggs in one basket. If the market suddenly turns, your exposure is now greater than what you may have intended. A quick look and rebalance of your allocations can reduce your risk and protect your savings.

REVIEW YOUR PLAN OFFERINGS

Make sure you’re familiar with any new features that may have been added to your plan, that you should be taking advantage of. Often new funds are added that may be better performing than previous funds or represent asset classes that didn’t exist in the past. Another new feature to look for is auto-escalation. This feature automatically increases the percentage of your pay going into the plan on an annual basis. If this is available as an opt-in feature, I strongly encourage electing to use it.

Whether you’re taking a number of extended weekends or a week-long break, use some of that time to review your 401k. What you learn and how you respond could go a long way to helping you enjoy your vacation even more and ensure many more relaxing days in the future.

Economic Lows. Market Highs. What’s Next?

Economic Lows. Market Highs. What’s Next?

Click to enlarge
Click to enlarge

The confounding thought about the market has been:  the economy is struggling, and yet the market is up.  I created a bar chart out of the 2 statistics:  GDP Growth and S&P Return, and then listed the year this occurred.  And then I have provided the actual numbers that support the chart, since there have been years with negative GDP that do not make a bold statement on the chart.

Notice, of the years shown, that in 1982 when arguably we were in the beginning stages of the bull market that lasted until the end of the 1990’s, that same year we had a negative GDP of -1.4%.  Notice the more “obvious” years, 1934, 2008, 1974, … there was no shock that a negative GDP correlated with a negative S&P… bad economy, bad market.

Our system of relative strength, shows the US Equities dominance since October 24, 2011.  And, currently, the numbers still overwhelmingly support that dominance going forward.

Click to enlarge
Click to enlarge

After experiencing two major bear markets in the last decade, investors big and small are demanding risk management.  However, it is important to remember that part of risk management is seeking to manage downside risk and part of it is seeking to capitalize in strong equity markets.

As a firm, we try to avoid economic forecasting.  As Yogi Berra, the great catcher and baseball coach said, “You can learn a lot by just watching.”  Be confident: we are watching.

Register Block 2